In the last two posts, I offered a "Pop-Quiz" on predicting stock prices. Today, I would like to ask the most important issue when attempting to use any form of predictive analytics in the financial markets. Do you even have a chance of getting reliable results? Or are you wasting your time? Back in 2003, when I first built the described Neural Network solution, it was my first naive take on the problem and I wasted a lot of time.
Today, with the expansion of machine learning research and mathematical techniques combined with the proliferation of open source tools, we are in a much better position to answer these questions directly. A few months back a new algorithm came to my attention via an interesting post on the FastML blog entitled "Are Stocks predictable". Check this link: http://fastml.com/are-stocks-predictable/
The short story is this: A PhD student at Carnegie Mellon University named Georg Goerg developed an algorithm and published his findings in what he called 'Forecastable Component Analysis'. This algorithm looks at a time-series and tries to determine how much noise vs. how much signal. The answer is provided as an 'Omega Score'. The algorithm was also provided as an R package ForeCA.
In English, if the data contains too much noise, attempts to predict the series will fail. This is really useful for stock prices. FastML shows that next day %changes for stock indexes have ridiculously low Omega scores, between 1.25% and 6%. Not enough to bank on.
I discovered a similar effect in my research. No matter how much you torture the input data, forecasting the next day's close is a fool's folly. It is analogous to attempting to predict the flip of a coin. However, what I have discovered (assuming I am interpreting the results correctly), is that as you go out in time, the results start to become more meaningful. So, what would happen if you fed the ForeCA algorithm with Percentage change values for 1,5,10,15,20,25, and 30 days in the future ?
Here are the results. Note: ForeCA reorders the columns from most to least forecastable (after transformation), so for the sake of simplicity, just pay attention to the 'Orig' series' omega scores and the top right bar chart. (bars labeled X1-Day through X30_DAY). As you can see, the noise/signal ratio and your ability to forecast improves as the number of days increases.
$Omega
Series 7 Series 4 Series 5 Series 6 Series 3 Series 2 Series 1
31.998529 28.954507 25.660565 23.572059 20.275582 11.857304 4.612705
$Omega.orig
X1_DAY X5_DAY X10_DAY X15_DAY X20_DAY X25_DAY X30_DAY
1.632106 11.253286 18.363721 22.831144 26.353855 29.138379 31.560240
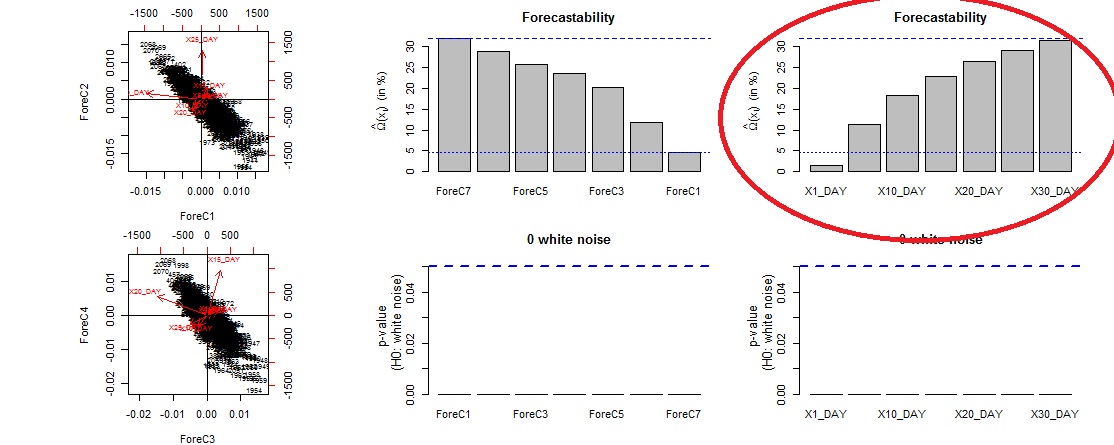
Again, assuming I am interpreting the results correctly, we have a 31.56% chance of getting the forecast right 30 days in the future. Still not enough to bank on. In the end, stock market success is not about the perfect algorithm or forecast or formula. It is about managing risk when your signal goes wrong.
(Note: I would have provided the R source code and input data, but it was left on my work laptop when I recently finished up a project with Cisco).